Australia’s Fuel Security — Part 1: The Position and the Government’s Response
Where the country actually stands on fuel, what the arrangement costs, and what the Government is doing about it. Part 1 of the Fuel Sovereignty pair; Part 2 carries the solutions.
Retitled. The pair now shares a common title. This memo is Part 1; the companion is “Australia’s Fuel Security — Part 2: Every Method of Domestic Production”. No content was changed.
§8 updated to the Government’s current settings: the Fuel Security Services Payment extended to 2030 with a raised collar and the Government’s own account of the original design, the rolling extension of the reduced stockholding obligation, the specific fuel-standard relaxations, the widened underwriting, the deferred Lytton turnaround, and the Budget’s counting of household solar and batteries as fuel-import security. New text is marked in blue.
Retitled. It was previously titled “The True Cost of ‘Cheap’ Imported Fuel”. The new title states what the memo covers: where Australia stands, and what the Government is doing about it. The companion Part 2 is now “Australia’s Fuel Security — Part 2: Every Method of Domestic Production”. No content was changed.
Substantially rewritten and restructured. Part 1 now carries the whole current situation — the dependence, the supply line, the record import data, the standing bill, the 2026 shock costs, and the Government’s response including the Minister’s 5 August National Press Club claims — with two new charts. The solution content has moved to Part 2. Because the memo is rewritten throughout, no change-marking is applied; the previous version is archived at archive/memo-true-cost-of-cheap-fuel-v1-3.
Added the import bill passing LNG export income (with chart), and the costs already sustained from international uncertainty — freight, war-risk insurance, re-routing and fuel queuing at anchor — itemised with sources.
Australia imports the great majority of the refined fuel it burns, on foreign ships, through two contested chokepoints, behind the thinnest reserve in the developed world. This memo sets out the current situation in full: how the dependence was built, the supply line that carries it, the record import volumes now being set, what the arrangement costs on a calm day, what the 2026 shock charged on top, and the Government’s response — measured against what each part of it actually does. The companion memo, Part 2, sets out how to fix it.
1. The numbers
- About 90 per cent of Australia’s refined fuel is imported; more than 94 per cent of the oil it produces is exported.
- Two refineries remain, both running imported crude, covering about 20 per cent of demand.
- The import task runs on 80–90 foreign tanker cargoes a month, through two contested chokepoints, on a supply line five to six weeks long.
- The 90-day reserve obligation has been unmet since 2012; IEA members average over 140 days of cover.
- Diesel — about 91 per cent imported — is the fastest-growing part of the task and the hardest to replace.
- In 2026 diesel passed $3 a litre, rationing was modelled near 10 days of stock, and the crisis response ran to about $14.8 billion.
- A decade of imports at the current bill runs to $500–600 billion — more than the lifetime cost of the AUKUS submarine programme.
2. How it happened
Between 2014 and 2021 Australia closed most of its refineries — Kurnell, Clyde, Bulwer Island, Altona, and finally Kwinana, the largest. Over the same years the merchant fleet shrank to almost nothing and the emergency reserve sat below the level the country had committed to hold.
Each decision rested on the same measure: the delivered cost of a litre on a normal day. On that measure the decisions were sound.
BP closed Kwinana citing “regional oversupply and sustained low refining margins”, adding the decision was “not in any way a result of local policy settings”. ExxonMobil closed Altona as no longer economically viable. Ampol’s Lytton lost $145 million in 2020. Every stated reason was a per-litre, single-firm margin reason. No one was tasked with weighing the cost to the nation of importing the lot.
The warnings existed. Import-dependence risk was flagged in national security assessments in 2009 and 2011; a refinery-loss supply shock was modelled in 2011; a parliamentary committee sought a fuel-security review in 2018; an interim review was published in 2019 and the final report was never released.
The 2019 review stated the position plainly: comparable countries treat fuel as strategic capability, while Australia “has chosen to apply minimal regulation or government intervention in pursuit of an efficient market that delivers fuel to Australians as cheaply as possible.” Britain made the same choices on the same logic and is now similarly exposed.
3. The export–import loop
Australia produces around 400,000 barrels of petroleum liquids a day, most of it light condensate from its gas fields. More than 94 per cent is exported to refineries across Asia. The country then imports about 90 per cent of the refined fuel it uses, plus the heavier crude its own two refineries are built to run on. It sells the oil, and buys the petrol and diesel back from the same region.
Table 1 — The supply gap (barrels per day, approximate)
| Flow | Volume (b/d) | Note |
|---|---|---|
| Petroleum liquids produced | ~400,000 | mostly light condensate from gas fields |
| Of that, exported | >94% | light sweet crude/condensate to Asian refineries |
| Total liquid-fuel consumed | ~1,150,000 | Australia ranks ~20th in the world for oil use |
| Refined product imported | ~850,000 | ~70–90% of consumption depending on month |
| Domestic refinery output | ~230,000 | capacity; covers only ~20% of demand |
Sources: EIA Australia Country Analysis 2025; Worldometer/EIA 2024; Australian Petroleum Statistics; Geoscience Australia, Australia’s Energy Commodity Resources 2025.
The two remaining refineries do not close the gap. Both run on imported crude, so even the fuel refined onshore depends on the same shipping lanes for feedstock. Their combined output — roughly 100,000 barrels a day of petrol and 80,000 of diesel — runs opposite to national demand, which is skewed toward diesel.
In 2025 the two plants produced 12 billion litres, about a fifth of national needs, and are supported to do so by the Fuel Security Services Payment, recalibrated in 2026 with its cap held at 1.8 cents a litre.
Table 2 — Australia's remaining refineries
| Refinery | Operator | Capacity (b/d) | Feedstock | Status |
|---|---|---|---|---|
| Geelong, VIC | Viva Energy | ~120,000 | imported crude | operating (supported to 2027+) |
| Lytton, QLD | Ampol | ~110,000 | imported crude | operating (supported to 2027+) |
| Total | ~230,000 | ~20% of demand | ||
| Closed 2014–21 | ~450,000 lost | Kurnell, Clyde, Bulwer Is., Altona, Kwinana |
Sources: Australian Petroleum Statistics; company reports; Liquid Fuel Security Review interim report 2019.
4. The supply line
Crude reaches the Asian refining hubs after roughly a three-week voyage from the Persian Gulf; the refined product then takes another two to three weeks to reach Australia. The pipeline feeding an Australian service station is five to six weeks long and passes two of the most contested waterways on earth. When a chokepoint closes, the line lengthens: diverting around the Cape of Good Hope adds one to two weeks, and in early 2026 vessels rerouted exactly that way.
Table 3 — The journey to the bowser (indicative)
| Leg | Distance | Sailing time | Typical vessel |
|---|---|---|---|
| Persian Gulf → Asian refineries | ~6,600 nm | ~19–20 days each way | VLCC (~2,000,000 bbl crude) |
| Singapore → eastern Australia | ~4,000 nm | ~12–16 days | MR product tanker |
| South Korea → eastern Australia | ~5,000 nm | ~16–20 days | MR / LR product tanker |
| US Gulf/west coast → Australia | — | ~30–35 days | product tanker |
Sources: standard maritime route/voyage data; vessel speed ~13–14 knots. Refined-product cargoes add port calls and transfers.
The task runs on foreign ships. There is not one Australian-flagged refined-product tanker on the register; the fuel arrives on roughly 80 to 90 foreign-flagged cargoes a month, dispatched by owners with no obligation to serve Australia first. In March 2026 the Energy Minister confirmed six fuel cargoes bound for Australia had been turned back or deferred, amid concern that suppliers such as Malaysia and South Korea would hold fuel for their own needs.
Table 4 — The import shipping task
| Measure | Figure |
|---|---|
| Refined product imported | ~850,000 b/d |
| Typical product (MR) tanker cargo | ~300,000 bbl (range 190,000–345,000) |
| Implied arrivals | ~3 cargoes a day, ~80–90 a month |
| Australian-flagged fuel tankers | 0 |
| Major Australian-flagged vessels (all types) | ~15 |
| Foreign-flagged ships carrying Australian trade (2019) | ~5,981 |
| Planned strategic fleet | ~12 ships |
Sources: Australian Petroleum Statistics; EIA tanker-size data; Australian General Shipping Register; MUA/Productivity Commission Vulnerable Supply Chains submissions, 2021; Strategic Fleet Taskforce.
One further single point of failure: about 99 per cent of Australia’s heavy diesel trucks require AdBlue to run legally, and AdBlue is made from urea synthesised from natural gas. During the 2026 crisis Australia’s urea stock was reported at around ten days of supply.
5. Demand is rising, and setting records
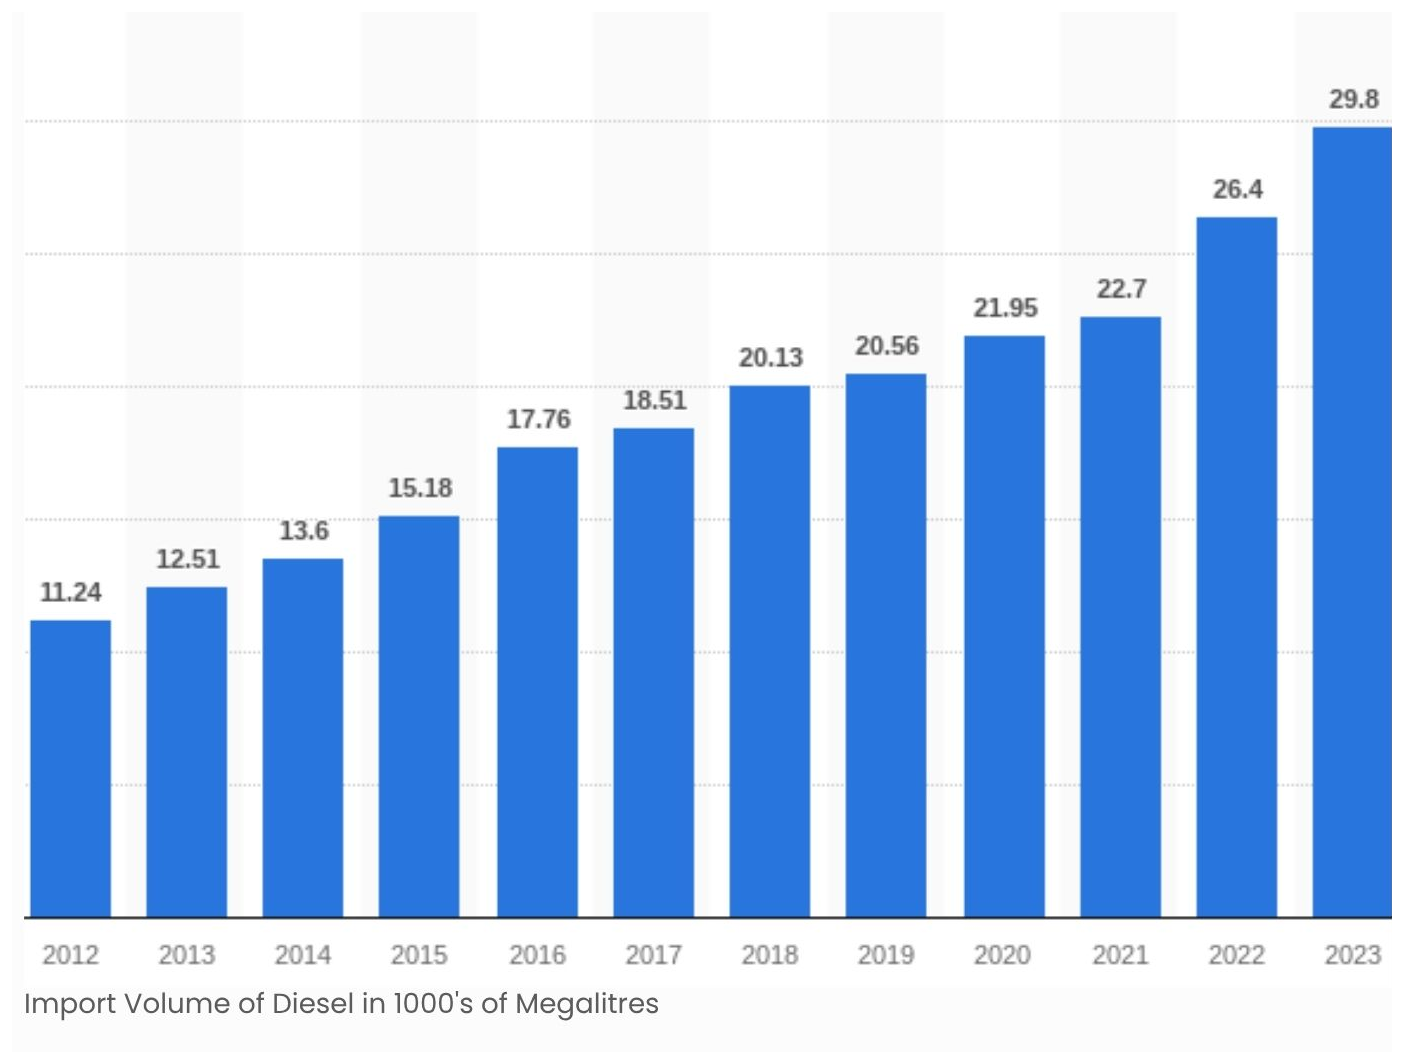
The import case assumed demand would level off and fall as the country electrified. It has done the opposite. Diesel imports rose from 11.24 thousand megalitres in 2012 to 29.8 thousand in 2023 — nearly tripling in eleven years — and by 2025 about 91 per cent of the diesel the country burns is imported. Diesel moves the freight, runs mining and agriculture, and backs up essential services; it is the hardest fuel to electrify quickly and the fastest-growing part of the task.
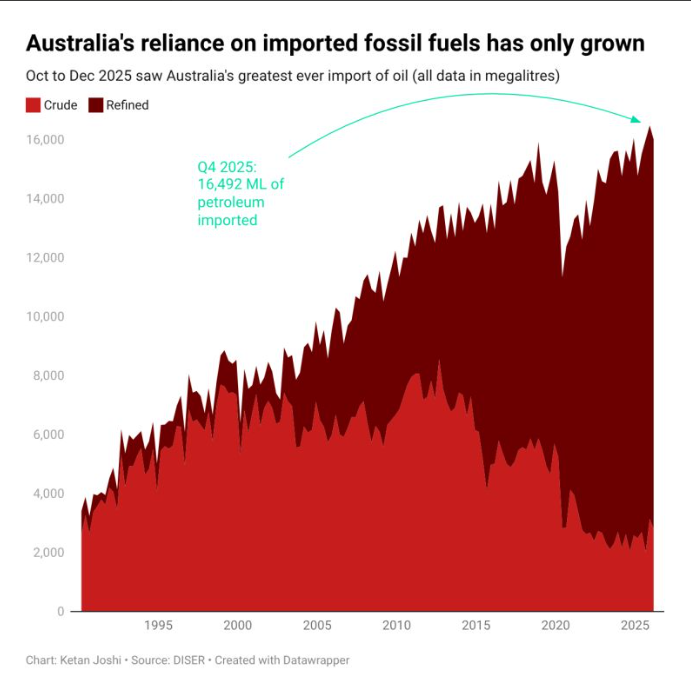
The record keeps being set. 16,492 megalitres of petroleum was imported in the December quarter of 2025 — the largest quarterly import in the country’s history. The composition tells the same story as the refinery closures: the refined share grows as the crude share falls away, because the plants that would have used the crude are gone.
6. The standing bill
The costs below run every year, shock or no shock. The table sets out the standing terms of the import arrangement; the sections after it carry the detail.
| Factor | The import arrangement |
|---|---|
| — COST — | |
| Headline price per litre, calm day | Lowest — the number the closures were judged on |
| Annual spend, and where it goes | ~$64bn in 2025–26 (up from ~$59bn in 2023) leaves the country, permanently |
| Public fuel-tax credits | ~$10bn/yr (2024–25) and rising — excise refunded on mostly imported diesel |
| Economic multiplier | ~Nil here — margin, wages and tax compound offshore |
| Reserve to hold | Bought as a standalone asset — the $3.2bn tank, inside the $14.8bn package |
| Security margin (90-day obligation) | $3.2bn reaches only 50 days; ~$20bn+ more to reach 90, then a yearly holding cost to insure, guard and cycle |
| Inflation pass-through | Imported inflation, currency-multiplied |
| — RISK — | |
| Price volatility | Full world price, no buffer |
| Currency (FX) | USD-priced; the AUD falls in the same shocks — hit twice |
| Freight + war-risk insurance | Thousands of km; spikes thousands-fold in a crisis; repriced permanently in 2026 (§7) |
| Shipping / fleet | Foreign ships; zero Australian-flagged fuel tankers |
| Chokepoint / supply chain | Hormuz + Asian refineries + tanker availability |
| Tail risk (the shock) | Priced at zero when the decisions were made; ~3–5c/litre hidden premium (§7) |
| — WHAT SITS OFFSHORE — | |
| Jobs | Offshore |
| Tax & royalties | Foreign refiners pay foreign tax; no royalties levied here |
| Company, payroll & income tax | The whole industry’s tax base sits offshore |
| Industrial capability | None retained; refining skills lost with the closures |
| Defence / strategic | Dependent, vulnerable, slow to fix |
| — WHERE THE ARRANGEMENT WINS — | |
| Upfront capital | None — you just buy |
| Availability | Immediate, while the routes hold |
| Carbon accounting | Refining emissions booked offshore — no Australian carbon cost recorded |
The headline row has moved since this ledger was first published at $59 billion (2023). On trade data compiled for this memo, the combined crude and product import bill reached about $64 billion in 2025–26 — and for the first time since 2020–21 it exceeded the nation’s entire LNG export income for the same year. For most of the years to 2017–18 the fuel import bill ran ahead of LNG income; the LNG boom reversed that; the 2026 oil shock reversed it back.
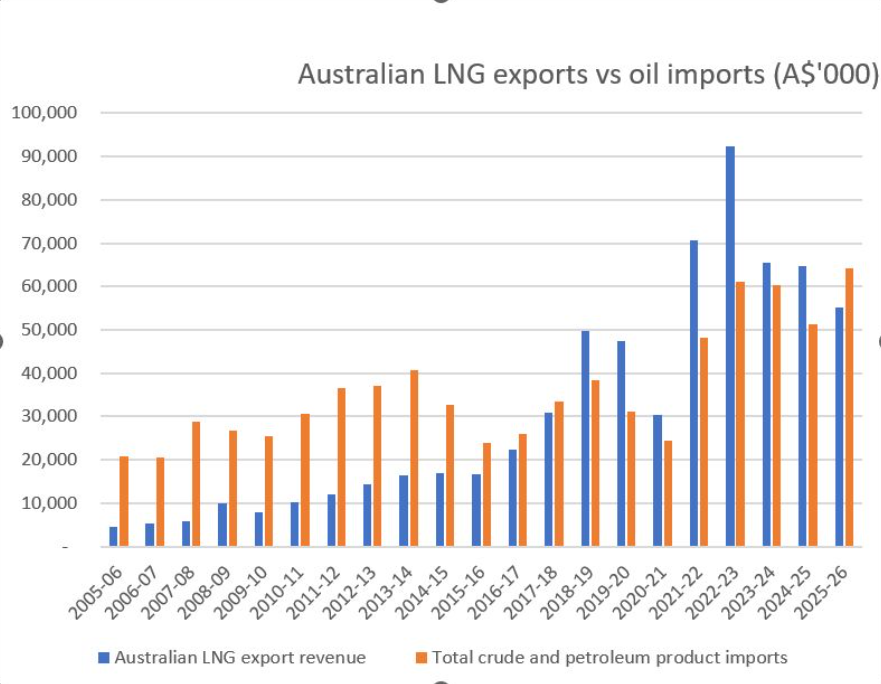
Where the money goes decides what it builds. The import spend pays the refining margin, the shipping, the insurance and the wages of other nations; it lands in no Australian payroll, plant or tax return. The value added in refining and handling the fuel — the margin, the wages, the company tax on both — is booked in the exporting countries, every year, in full.
Because the country makes almost none of its own fuel, it must also buy its entire security margin and store it. The 90-day IEA obligation, held at about 37 days, would take on the order of six billion more litres to meet — indicatively another twenty billion dollars and more in fuel and tankage, then a permanent annual bill to insure, guard and cycle stock that degrades and, once drawn, drains.
Two further standing charges. The Fuel Tax Credit scheme refunds excise on off-road and heavy-vehicle diesel at about $10 billion a year and rising — under the import model, public money rebating tax on fuel bought overseas.
As a price-taker the country absorbs the world’s volatility in full, twice over: fuel is priced in US dollars, and the Australian dollar tends to fall in exactly the global crises that push oil up. Every litre also carries the world’s tanker freight and war-risk insurance, which reach the pump within weeks when they move.
7. The shock: what 2026 charged
When the Strait of Hormuz closed, Australia watched diesel pass three dollars a litre, forecourts run dry, and officials model rationing if stocks fell toward ten days.
The response was the $14.8 billion Strengthening Australia’s Fuel Resilience Package. Its components are parts of that total: $7.5 billion of underwriting that secured around 740 million litres of diesel and 150 million litres of jet fuel; $3.2 billion for a permanent government reserve lifting cover toward 50 days; and $2.9 billion halving the fuel excise and zeroing the heavy-vehicle road-user charge for three months.
Alongside sat the reserve drawdown, relaxed fuel standards and the rationing modelling. Every dollar bought, borrowed, stored or discounted existing fuel; none of it made a litre.
The excise cut is forgone revenue — tax the Treasury chose not to collect so the pump price would not climb further. It is the lever of a price-taker: a country that imports the world price, and its inflation with it, can only pay to soften the pass-through.
Priced across a decade, a shock of this size occurring once works out to a hidden risk premium of roughly three to five cents on every imported litre — a line the per-litre comparison never carried. And the shock is also a transfer: the same chokepoint that drained the pumps was a windfall for the companies extracting Australian oil for export, with the six largest majors projected to earn around US$94 billion for the year, about US$37 million a day above the year before.
By mid-2026 the premium had stopped being an estimate. It had an itemised bill — costs sustained from the uncertainty alone, while every cargo still arrived. Brent passed US$100 a barrel on 8 March and peaked near US$126, up roughly 65 per cent in ten days.
Freight repriced harder than the oil. Persian Gulf crude cargo rates were assessed up 461 per cent for the year by early March, daily earnings on the largest tankers rose several-fold, and ships rerouting around the Cape of Good Hope added ten to fourteen days a voyage.
Because marine fuel is priced globally, emergency bunker surcharges landed on every trade lane — including Australian routes that never go near the Gulf — and the suppliers who replaced Gulf-linked cargoes with Argentine and US Gulf Coast product paid longer voyages and higher freight to do it.
Insurance repriced the same way, and the reinsurance market itself says it will not fully reprice back. War-risk cover for a single Gulf transit ran at 0.15 to 0.25 per cent of a ship’s hull value before the crisis, touched five per cent at the peak, and settled near one per cent — still several times the old rate.
Broker analysis of the 2026 losses — at least seven tankers hit, on the order of US$1.75 billion before cargo — describes the Red Sea and Hormuz years together as a permanent structural repricing of marine war risk. Every such cost is levied per litre carried, and Australia carries nearly every litre it burns.
Some of the fuel then paid to wait. Through mid-2026, laden tankers sat at anchor off Australian ports for weeks against a normal turnaround of two to three days — one product tanker waited some eight weeks off Wollongong before discharging — and by August roughly 670 million litres of the nation’s reported diesel stock was estimated to be afloat in the exclusive economic zone rather than in a tank on shore.
Idle chartered tankers bill by the day, and fuel counted in the headline “days of supply” while it rides at anchor is a reserve the country is paying freight on but cannot yet pump.
None of these costs required a blockade of Australia. No shortage occurred; every cargo landed. This is what the import path charges for uncertainty alone, and on the insurers’ own assessment part of that charge is now permanent.
8. The response: business as usual
Set the Government’s full 2026–27 response out as a register and its shape is uniform.
Buying. Commercial fuel purchases underwritten through the export-finance agency — around 800 million litres of diesel plus jet cargoes the market would not carry unaided. The Prime Minister personally secured 100 million litres from Brunei and South Korea. The Minister’s weekly updates report the billions of litres “locked in for delivery” over each coming month: a purchasing schedule, reported as reassurance.
Storing. The $3.2 billion government reserve and the push toward 50 days of cover — all of it filled by the same foreign-flagged tankers on the same routes.
Stretching. A 762-million-litre release authorised from reserves; the minimum stockholding obligation cut 20 per cent in the middle of the crisis it exists for, and then extended — a second instrument commenced on 1 July 2026 as the first expired, carrying the reduction through to 30 September.
Fuel-quality standards were relaxed in two places: petrol sulfur limits lifted so that 80 to 100 million litres a month of non-compliant fuel could be sold domestically rather than exported for blending, and the diesel flashpoint requirement lowered from 61.5°C to 60.5°C for six months.
Paying to keep the two refineries open. The Fuel Security Services Payment was recalibrated after a six-month review and extended from 2027 to 30 June 2030. Its cap stayed at 1.8 cents a litre, but the collar rose from 6.4 to 10.0 cents and the margin marker was adjusted, so payments now begin at a quarterly refining margin near A$15.90 a barrel against a previous floor around A$7.30.
The Government’s own account of why is worth quoting: the design “was flawed — with refiners only accessing payments twice since 2021”, and the change carries “no additional costs to the Commonwealth”. It is a threshold adjustment, not new money.
The commitments it buys are shorter than the headline. To receive the payment a refiner must commit to operate until at least 30 June 2027, with an option to extend to 2030; Ampol has committed to 2027 and Viva to 2028, and the Government states that both “are progressing plans to keep operating into the next decade”. The two plants produced 12 billion litres in 2025 — about a fifth of national needs — and both run on imported crude.
One measure in the whole register did add Australian-refined litres. Ampol deferred the scheduled turnaround at Lytton from June to August 2026, producing about 300 million litres of petrol, diesel and jet fuel that would otherwise have been lost to maintenance. It is real production, from imported crude, bought by postponing maintenance on a plant already running at full capacity.
Producing Australian fuel. Ten million dollars of refinery feasibility studies, co-funded with the states — less than one dollar in every thousand of the response.
Underwriting also widened. Export Finance Australia began with Ampol and Viva and was extended to the smaller regional operators IOR and Park Fuels, and the minimum stockholding obligation is to rise by about ten days for every fuel type, phased over four years with $34.7 million allocated to administer the uplift.
The demand side carries the forward claims, and the arithmetic should travel with them. The New Vehicle Efficiency Standard is credited with about $95 billion of motorist fuel savings by 2050 — a dollar figure, cumulative over 24 years, new light vehicles only; in its first compliance year transport emissions fell 0.4 per cent against a 23 per cent rise since 2005.
Electric-vehicle uptake is credited with avoiding 15 million litres of fuel a week — about 780 million litres a year, against the 16,492 million litres imported in the December quarter alone.
The largest claim came at the National Press Club on 5 August 2026, when the Minister for Climate Change and Energy said the Safeguard reform is “expected to save 18 billion litres of diesel between now and 2035”, describing it as “over 190 days of diesel supply”. Three things about that figure are checkable.
The arithmetic is internally consistent — 18 billion litres is about 190 days at current diesel use — but “days of supply” is the vocabulary of stockholding applied to nine years of projected demand reduction. Spread over the period, the claim is roughly 1.9 billion litres a year, around six per cent of the diesel the country burns.
The published Safeguard documents contain no litres measure at all. Facility baselines are set in tonnes of carbon dioxide equivalent, and a facility can comply in full by surrendering carbon credits while its fuel use is unchanged. And in the same address the Minister confirmed the diesel rebate — the roughly 50-cents-a-litre credit whose value is about five times the cost of exceeding a Safeguard baseline — would not change: “we have no plans to change it.”
The Budget’s own fuel-security chapter counts other things toward the same problem: 6.8 gigawatts of renewable generation in 2025, more than 370,000 home batteries, and four million households generating their own solar, listed under reducing dependence on imported fuels.
The Minister’s assessment is that “Australia in 2026 is significantly more energy secure than the situation we found ourselves in when we formed Government in 2022”. Household solar does not make diesel, and the aircraft, trucks, ships, tractors and mining fleets that consume it cannot be plugged in.
On the production question the position is on the record. Asked in April 2026 whether the fuel crisis should lead to expanded domestic production, the Minister answered: “Well, no… there are some who say the answer to this is to somehow become more reliant on fossil fuels. That’s not a view I share.” The register above is consistent with that answer. Every measure in it buys, stores, stretches, discounts or claims future savings on imported fuel; none of it produces any.
9. The full number
Add the columns and the account reads: about $64 billion a year leaving the country and now exceeding LNG export income; about $10 billion a year of excise rebated on mostly imported diesel; a $14.8 billion crisis package of which $10 million concerns producing fuel; a hidden risk premium of three to five cents a litre that 2026 converted into an itemised bill; and freight and war-risk costs the reinsurance market assesses as permanently repriced.
At the current bill, a single decade of imported fuel runs to $500–600 billion or more — more than the entire lifetime cost of the AUKUS submarine programme — spent every year, offshore, building nothing here. The number that closed the refineries was never the full number.
That is the current situation. The path that ends it is set out in the companion memo, Part 2 — Australia’s Fuel Security — Part 2: Every Method of Domestic Production.
References
- Refinery closures and timeline; stated closure reasons — Australian Petroleum Statistics (DCCEEW); BP media statement on Kwinana, 30 October 2020 (“regional oversupply and sustained low refining margins”; “not in any way a result of local policy settings”); ExxonMobil statement on Altona, February 2021; Ampol 2020 results (Lytton loss of $145m); ministerial statement on Kwinana, 2020.
- Warnings timeline — National Energy Security Assessments 2009 and 2011; ACIL Tasman Liquid Fuels Vulnerability Assessment 2011; PJCIS recommendation 2018; Liquid Fuel Security Review interim report, April 2019 (final never released), including the “minimal regulation or government intervention” finding quoted in §2.
- Production, exports and consumption (§3, Table 1) — EIA Australia Country Analysis 2025; Geoscience Australia, Australia’s Energy Commodity Resources 2025; Worldometer/EIA 2024; Australian Petroleum Statistics.
- Refineries (§3, Table 2) — Australian Petroleum Statistics; company reports; DCCEEW, “Securing Australia’s fuel sovereignty” (Fuel Security Services Payment recalibrated after a six-month review, cap held at 1.8c/L; 12 billion litres produced in 2025, ~20% of annual needs).
- Supply line and shipping task (§4, Tables 3–4) — standard maritime route and voyage data; EIA tanker-size data; Australian General Shipping Register; MUA/Productivity Commission Vulnerable Supply Chains submissions, 2021; Strategic Fleet Taskforce; ministerial confirmation, March 2026, of six cargoes turned back or deferred.
- AdBlue/urea exposure (§4) — ~99% of heavy diesel trucks require AdBlue; 2026 urea stock reported near ten days — industry and contemporary reporting.
- Diesel import growth and share (§5) — Australian Petroleum Statistics: 11.24 thousand ML (2012) to 29.8 thousand ML (2023); ~91% of diesel imported by 2025.
- Record quarterly import (§5) — Australian Petroleum Statistics / DISER data: 16,492 ML of petroleum imported, October–December 2025; chart by Ketan Joshi from DISER data.
- Import bill and LNG comparison (§6) — ~A$59bn in 2023 (DFAT trade statistics / Australian Petroleum Statistics); ABS international trade in goods data, financial-year series compiled by Modern Movement Australia (2025–26 import bill ~$64bn, exceeding LNG export income for the first time since 2020–21).
- Reserve position and 90-day obligation (§6) — IEA oil-stock data (~37 days held; obligation unmet since 2012; member average ~140+); DCCEEW.
- Fuel Tax Credit (§6) — ~$10bn/yr (2024–25) and rising; Budget papers attribute growth to rising eligible fuel use; OECD/IEA classify it as a fossil-fuel subsidy, the government and industry reject the term.
- 2026 crisis response (§7) — Budget 2026–27 fuel-security papers; ministerial releases ($14.8bn package; $7.5bn underwriting facility, ~740 ML diesel / ~150 ML jet; $3.2bn reserve toward 50 days; $2.9bn excise halving and road-user-charge pause; ~20% reserve drawdown; relaxed standards; rationing modelling).
- Oil-producer windfall (§7) — six majors projected ~US$94bn for 2026, ~US$37m/day above 2025 — Oxfam International analysis, 2026; Fortune; company Q1 2026 results.
- 2026 freight and oil repricing (§7) — S&P Global Platts commodity tracker, 3 March 2026 (Persian Gulf crude cargo rates $62.07/mt, up 461% from the start of the year); IRU fuel analysis, March 2026 (Brent up ~65% between 27 February and 9 March, peak ~US$126); shipping-industry reporting on Cape of Good Hope re-routing (+3,500–4,000 nm, +10–14 days) and emergency bunker surcharges across all trade lanes; Australasian Convenience and Petroleum Marketers Association on replacement sourcing from Argentina and the US Gulf Coast (National Bulk Tanker Association panel, May 2026).
- War-risk insurance repricing (§7) — marine-insurance market reporting, 2026 (additional war-risk premium 0.15–0.25% of hull value pre-crisis, peaks near 5%, easing to ~0.8–1%); Howden Re, Strait of Hormuz report, 26 March 2026 (at least seven tankers struck, ~US$1.75bn implied industry losses before cargo; Red Sea 2024–25 plus Hormuz 2026 assessed as a permanent structural repricing of marine war risk).
- Fuel afloat and waiting tankers (§7) — crudeoilpeak.info analysis of DCCEEW minimum-stockholding statistics, 1 August 2026 (~670 ML of reported diesel stock estimated offshore in the EEZ; the tanker GRAND WINNER 5 held ~8 weeks off Wollongong before discharge; a second product tanker waiting from 12 July against a 2–3 day norm).
- The 2026–27 response register (§8) — ministerial and departmental releases: Export Finance Australia cargo underwriting (~800 ML diesel plus jet fuel); the 100 ML secured from Brunei and South Korea; weekly fuel-security updates reporting litres “locked in for delivery”; the $10 million refinery feasibility studies co-funded with the states.
- Demand-side claims (§8) — New Vehicle Efficiency Standard impact analysis (~$95 billion motorist fuel savings to 2050; ~321 Mt CO₂); first NVES compliance reporting, February 2026 (transport emissions −0.4% against +23% since 2005); C. Bowen, press conference, April 2026 (EV uptake “avoiding the use of 15 million litres a week of fuel”; on expanded domestic production: “Well, no… that’s not a view I share”).
- The 18-billion-litre claim (§8) — C. Bowen, Address to the National Press Club, 5 August 2026 (Safeguard reform “expected to save 18 billion litres of diesel between now and 2035… over 190 days of diesel supply”; the diesel rebate: “we have no plans to change it”). Examined against DCCEEW Safeguard Mechanism documents (baselines set in t CO₂-e; compliance by credit surrender; no litres measure published); credit-versus-penalty arithmetic per Fortescue’s 2026 Productivity Commission submission (~$0.50/L credit ≈ 5× the cost of exceeding a baseline).
- AUKUS cost comparison (§9) — see the companion memo The AUKUS Cost Blowout; programme costed in the hundreds of billions over its life, boats arriving through the 2040s.