Solar Sizing for the SBC: Reaching 1,000 GW
The arithmetic of the resource, the deployment footprint, and the power output. Why 1,000 gigawatts is not a stretch goal — it is what fits comfortably inside the four central Australian Solar Regions, with room to scale further as Asian demand grows.

1. What This Memo Does
The Sovereign Build Corporation (SBC) programme rests on a claim that needs to be demonstrated to anyone — partners, funders, journalists, members of the public — encountering it for the first time. The claim is that Australia can power itself and become one of the world’s major clean energy exporters from a fraction of the central Australian desert.
This memo does the arithmetic behind that claim. It works through how big the available solar resource actually is, how much land 1,000 gigawatts of installed solar actually occupies, how much electricity that actually produces, what the addressable Asian export market actually looks like, and how the programme is engineered to scale further as demand grows.
The numbers in this memo are pre-feasibility — within roughly ±20-30% of detailed engineering values. That is appropriate for a programme being publicly proposed and seeking partner engagement. The order of magnitude — that 1,000 GW occupies a small fraction of the resource and produces multiples of Australian domestic demand — is robust to reasonable variation in any single assumption.
The headline finding: the four Solar Regions could host the full 1,000 GW deployment on approximately 2.6% of their combined area. The remaining 97% stays available for other uses. And the programme can scale meaningfully above 1,000 GW if Asian demand justifies the build, while still occupying less than 5% of the available zone. Land is not the constraint on the SBC. The constraint is the decisions to build it.
2. The Solar Resource
2.1 Why central Australia is exceptional
Australia’s inland solar resource is the largest of any inhabited continent. Three measures of solar resource quality matter for utility-scale deployment: peak sun hours per day, capacity factor, and seasonal variation.
- Peak sun hours per day: central Australia averages 7.5 peak sun hours per day. This is the highest sustained irradiance on any inhabited continent and is matched only by parts of the Sahara and the Arabian Peninsula. For comparison: Texas averages 5.5–6.0; Spain 5.0–5.5; Germany 3.0–3.5; the United Kingdom 2.5–3.0.
- Capacity factor: the fraction of nameplate capacity actually delivered as energy across a year. Modern utility-scale single-axis-tracking solar in central Australia achieves 22–26%. The conservative end (22%) corresponds to fixed-tilt installations and standard panel performance; the upper end (26%) requires single-axis tracking, bifacial modules, and well-maintained installations. The mid-range estimate (24%) is the planning assumption used through this memo.
- Seasonal variation: central Australia has the lowest seasonal variation of any major solar resource zone in the world. Summer-to-winter generation ratio is approximately 1.4:1, compared with 4:1 in Germany or 6:1 in the United Kingdom. The output is more uniform across the year, reducing the storage burden on integrated systems.
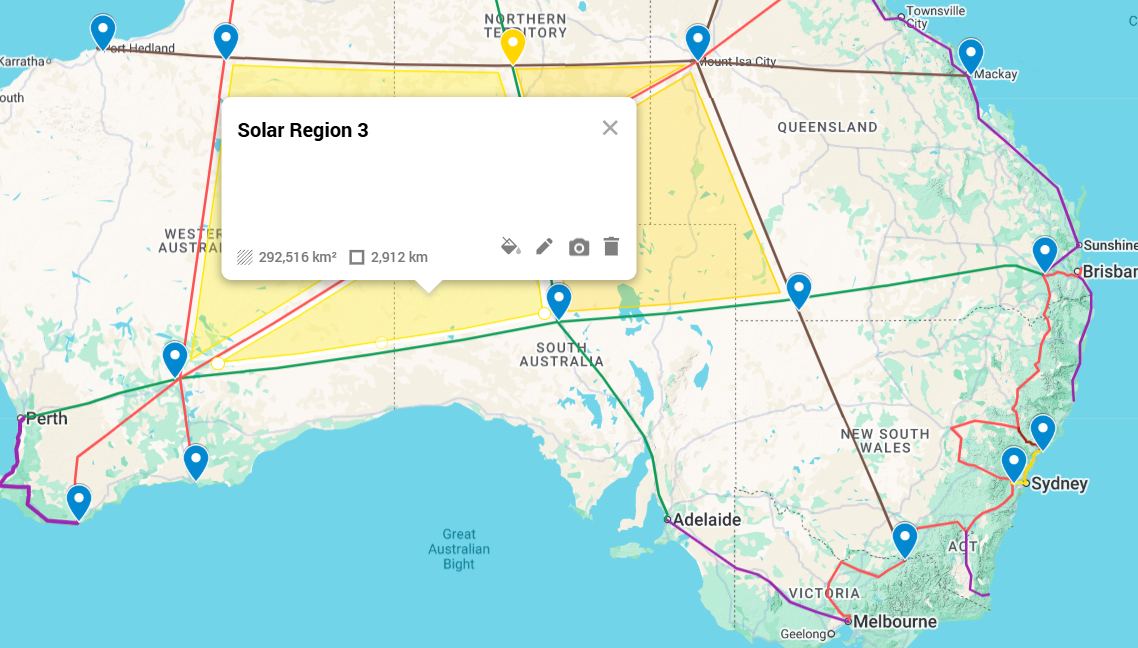
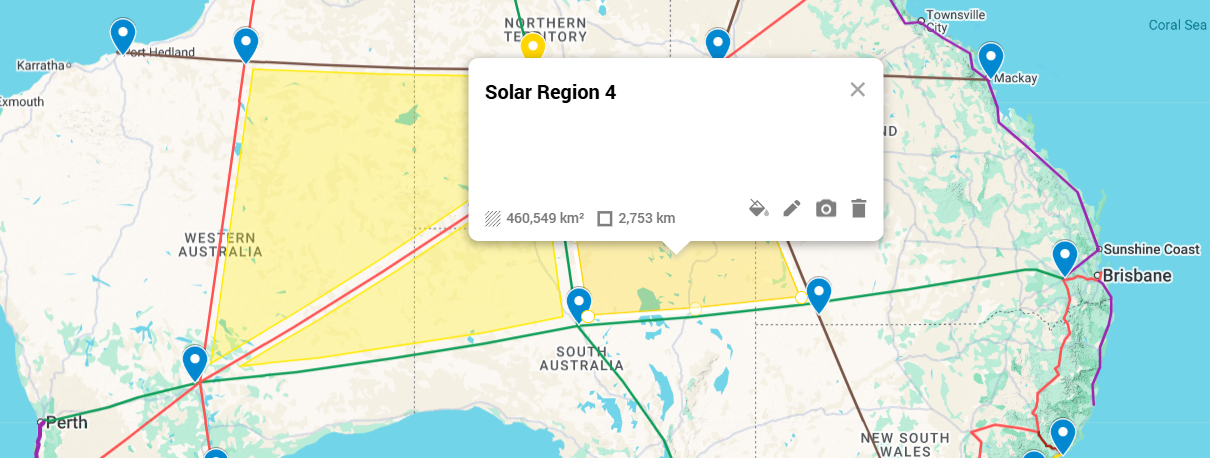
2.2 The four Solar Regions
The SBC programme has identified four contiguous Solar Regions in central Australia where solar deployment is most viable, accessible, and corridor-compatible:
| Region | Area (km²) | Approximate location |
|---|---|---|
| Solar Region 1 | 89,339 | Central NT, north of Alice Springs |
| Solar Region 2 | 702,797 | Northwestern NT and eastern WA — the Tanami / Great Sandy Desert zone |
| Solar Region 3 | 292,516 | South-central — northwest SA into WA, the Great Victoria Desert |
| Solar Region 4 | 460,549 | Western, north WA into northwest NT |
| Total | 1,545,201 | About 20% of Australia’s land area |


For scale: 1,545,201 km² is approximately the size of Iran, twice the size of Texas, or six times the size of the United Kingdom. The combined area of the four Solar Regions is larger than 165 of the 195 countries on Earth.
3. The Land Footprint at 1,000 GW
3.1 Modern solar density
Modern utility-scale single-axis-tracking solar farms deliver approximately 40 to 60 MW of installed capacity per square kilometre, accounting for panel area, inter-row spacing, access roads, and equipment pads. The high end of the range applies to flat sites with good orientation and modern bifacial panels — the conditions central Australia overwhelmingly delivers.
The planning assumption used in this memo is 50 MW per km² — the mid-range modern value. At this density, 1,000 GW of installed solar requires:
1,000,000 MW ÷ 50 MW/km² = 20,000 km² of installed solar land
3.2 Real-world deployment area
The 20,000 km² figure is the theoretical floor. The realistic deployment area is somewhat larger because not all selected land is panel-suitable:
- Buffer zones around indigenous heritage sites, ecological reserves, and watercourses
- Topographic exclusions where slopes or terrain reduce panel efficiency
- Easement zones around HVDC transmission, water mains, and access tracks
- Operational and maintenance access strips between panel arrays
A realistic working assumption is that effective deployment area is 1.5 to 2 times the theoretical panel footprint. At 2 times the floor, 1,000 GW occupies approximately 40,000 km² — the figure used in the SBC Consortium Prospectus and consistent with deployment patterns observed in operational utility-scale solar at scale globally.
3.3 The headline number: 2.6%
40,000 km² of deployment across the four Solar Regions totalling 1,545,201 km²:
40,000 ÷ 1,545,201 = 2.59% — about 2.6%
The remaining 97.4% of the Solar Region area stays available for other uses. This is the headline of the Solar Regions argument: the SBC programme does not industrialise central Australia. It uses a small fraction.
3.4 What this looks like compared to known places
| Comparison | Area (km²) |
|---|---|
| 1,000 GW SBC footprint | ~40,000 |
| Tasmania | 68,401 |
| Simpson Desert | 176,000 |
| Tanami Desert | 184,000 |
| Great Victoria Desert | 348,750 |
| Solar Region 1 alone (the smallest of the four) | 89,339 |
The 1,000 GW installation fits comfortably inside the Simpson Desert with room to spare. It occupies less than half of Solar Region 1, the smallest of the four. The four Solar Regions combined are nearly forty times the area required.
Land is not the constraint. Vision is.
4. The Power Output at 1,000 GW
4.1 Annual energy production
Annual energy output from installed solar capacity is the product of three quantities: installed capacity (in megawatts), hours in a year (8,760), and capacity factor (22–26% for the central Australian resource).
| Capacity factor | Source | Annual output (TWh/yr) |
|---|---|---|
| 22% | Conservative — fixed tilt, average maintenance | 1,927 |
| 24% | Mid-range planning — single-axis tracking | 2,102 |
| 26% | Aggressive — single-axis bifacial, optimal maintenance | 2,277 |
The planning assumption is the mid-range figure: approximately 2,100 TWh per year at 1,000 GW installed.
4.2 What that means for Australia
Australia’s total electricity consumption (all sources, all sectors) in 2024 was approximately 265 TWh per year. The 1,000 GW SBC programme produces:
2,100 TWh ÷ 265 TWh = about 7.9 times Australia’s current total electricity demand
Even if Australian electricity demand grows substantially through electrification of transport, heating, and heavy industry — a plausible scenario seeing demand rise to 500 TWh/yr by 2050 — the 1,000 GW programme still produces approximately 4.2 times the projected 2050 domestic demand.
This is the basis for the SBC 50/50 split: 500 GW for Australia (powering the electrified domestic economy with substantial headroom for hydrogen and ammonia production, AI compute, desalination, heavy industry, and corridor town demand) and 500 GW for export.
4.3 The Asian export market
The eight major Asian electricity markets reachable by HVDC submarine cable from Australia have a combined demand of approximately 293 GW average and approximately 2,575 TWh per year. These markets are:
| Market | Average demand (GW) | Annual demand (TWh/yr) |
|---|---|---|
| Singapore | 6.3 | 55 |
| Indonesia | 35 | 305 |
| Malaysia | 22 | 195 |
| Thailand | 27 | 235 |
| Vietnam | 32 | 280 |
| Philippines | 14 | 125 |
| Japan | 110 | 970 |
| South Korea | 47 | 410 |
| Combined (today) | 293 | 2,575 |
The 500 GW export portion of the SBC programme produces approximately 1,050 TWh per year — about 41% of the combined annual demand of those eight markets at today’s levels. Real market share at maturity will be meaningfully smaller than 41% — those countries also have their own domestic generation, other suppliers compete, and submarine cable losses reduce delivered energy. But the resource is sized correctly: the SBC export programme is bounded by transmission build-out and market access negotiations, not by Australian sun.
And critically — the 2,575 TWh/yr figure is today. Tomorrow’s number is much larger.
5. Demand is Rising — The Programme Scales
5.1 Asian demand is growing fast
Southeast Asian electricity demand has been growing at roughly 5–7% per year for two decades and is projected to continue at similar rates through 2050. The IEA’s mid-case projections show Southeast Asian electricity demand approximately doubling between 2024 and 2050. Indonesia alone — currently 305 TWh/yr — is projected to reach approximately 1,300 TWh/yr by 2050 in mid-case industrialisation scenarios. That single country’s growth in absolute demand exceeds Australia’s entire current consumption.
By 2050, the eight markets reachable from Australia could plausibly demand 4,500–5,000 TWh per year — nearly double today’s figure. The same 500 GW export from the SBC would represent only 21–23% of the 2050 market — a meaningful share, but well within commercially achievable territory if the export build-out keeps pace with demand growth.
5.2 Data centres and AI are the wild card
Global data centre electricity consumption is approximately 460 TWh per year today and is on a doubling trajectory. The IEA’s 2024 reporting projects global data centre demand could reach 1,000+ TWh per year by 2030 if AI compute growth continues at observed rates. By 2050, data centre demand alone could exceed 3,000 TWh per year globally — equivalent to today’s entire combined Asian electricity consumption.
This is a different kind of demand than residential or industrial growth. Data centres need cheap, abundant, clean, and continuous electricity. They will locate where electricity meets all four conditions. Australian central desert solar — with the world’s best irradiance, low seasonal variation, and an integrated programme of corridor-borne transmission and pumped-hydro firming via the Alice Hub — is one of a small number of places on Earth that can meet all four at scale.
Australia faces a strategic choice. Either the data centres and AI compute load locate offshore (in markets with weaker electricity economics but better incumbent infrastructure) and Australia exports raw electricity to feed them — or the data centres and AI compute locate in Australia, alongside the corridors and the solar fields, and Australia exports compute services rather than raw electricity. Both paths use the same generation. The difference is whether the high-margin downstream economy is captured here or elsewhere.
5.3 What expansion above 1,000 GW looks like
The SBC corridor architecture is engineered for expansion. Six SBC corridors — each carrying integrated transmission, water, gas, fibre, and transport — provide the backbone. The transmission component of each corridor is designed in stages: a base deployment that delivers Phase 1 export capacity, with the easements, foundations, and substations sized for future upgrade as demand justifies additional circuits. The corridor design standard accommodates approximately 100 GW per corridor at full upgrade. Across six corridors, that is 600 GW of corridor transmission — supplemented by additional generation zones connected by shorter spurs.
The 1,000 GW programme target is what the corridor architecture supports comfortably with current technology and current market sizing. Expansion above 1,000 GW is engineered as a possibility, not a commitment. Three pathways:
- More circuits per corridor. Adding parallel UHVDC circuits to existing corridors as demand grows. The easements are already sized for this.
- Higher-voltage technology. Per-circuit capacity has been growing roughly 50% every fifteen years over the past five decades. By 2050 a single UHVDC circuit may carry 18–20 GW rather than today’s 10–12 GW. Same easement, more capacity.
- Generation zone expansion. The current Solar Region polygons cover the highest-quality and most corridor-accessible land. Reasonable extensions remain available within the broader inland zone.
At 1,500 GW — a 50% expansion — the deployment footprint becomes approximately 60,000 km², or about 3.9% of the four Solar Regions. At 2,000 GW — doubling the current target — the footprint is approximately 80,000 km², about 5.2% of the regions. Even at double the programme target, 95% of the Solar Region area stays available for other uses.
| Programme size | Annual output (TWh/yr at 24% CF) | Footprint (km²) | % of Solar Regions |
|---|---|---|---|
| 500 GW (Phase 1 milestone) | ~1,050 | ~20,000 | 1.3% |
| 1,000 GW (current target) | ~2,100 | ~40,000 | 2.6% |
| 1,500 GW (expansion scenario) | ~3,150 | ~60,000 | 3.9% |
| 2,000 GW (long-term ceiling) | ~4,200 | ~80,000 | 5.2% |
The honest framing: the SBC programme is sized for 1,000 GW because that is what the corridor build-out, the cable manufacturing capacity, the financing architecture, and the demand-side commitments support over the next two decades. It is not the maximum the resource supports. As Asian demand grows, as data centres seek clean power at scale, and as electrification continues, the programme can scale further. The land doesn’t constrain that. The build doesn’t constrain that. Only the decision to scale it does.
6. Why This Memo Stops Here
This memo is deliberately scoped to the solar sizing question. It establishes:
- The available resource (4 regions, 1.5 million km²)
- The deployment footprint at 1,000 GW (about 40,000 km² — 2.6% of the regions)
- The power output (about 2,100 TWh/yr — about 8 times current Australian demand)
- The market that justifies the 50/50 domestic/export split (8 Asian markets, 2,575 TWh/yr today, ~5,000 TWh/yr by 2050)
- The expansion pathway above 1,000 GW (still <5% of the regions even at 2,000 GW)
It does not address — and these are deliberately left for separate memos — the agrivoltaic productive land use case for the unused 97% of the regions; the corridor town settlement architecture at 100 km spacing; the Alice Hub aqueduct and water systems that make the regions habitable and the panels maintainable; the indigenous partnership framework as foundation rather than afterthought; the financing architecture; the manufacturing programme behind the panels; and the submarine cable engineering.
The reason for the narrow scope: the solar sizing arithmetic is the first claim that gets challenged when the SBC programme is presented to anyone new. “You’re going to power Australia and Asia? From the desert? On how much land?” This memo answers that question with the numbers and the workings, and lets every other memo stand on the foundation that the resource is genuinely there.
7. Assumptions and Caveats
| Assumption | Value | Confidence | Notes |
|---|---|---|---|
| Modern PV installed density | 50 MW/km² | High | Industry standard for utility-scale single-axis tracking |
| Effective deployment multiplier | 2× theoretical floor | Medium-High | Accounts for buffers, easements, exclusions |
| Australian central capacity factor | 24% mid-range | High | Multiple Australian operational PV plants validate this range |
| Solar Region areas | 1,545,201 km² total | High | Polygon measurements verified against the SBC corridor route plan |
| Hours in a year | 8,760 | High | — |
| Australian electricity demand 2024 | 265 TWh/yr | High | AEMO and AEMC published data |
| Asian market combined demand today | ~2,575 TWh/yr | Medium | IEA / IRENA data; varies year to year |
| Asian demand 2050 mid-case | ~5,000 TWh/yr | Medium-Low | IEA mid-case projection; significant uncertainty |
| Data centre demand 2050 | ~3,000+ TWh/yr globally | Low-Medium | IEA projection; AI compute trajectory adds uncertainty |
| 1,000 GW programme target | Locked | Locked | SBC Consortium Prospectus, Chapter 3.3 |
| Per-corridor transmission ceiling | ~100 GW at full upgrade | Medium-High | Engineering ceiling on six-corridor architecture |
The figures in this memo are pre-feasibility — within approximately ±20-30% of detailed engineering values. Detailed engineering studies are required before the programme moves into binding commitment. The order of magnitude — that 1,000 GW occupies a small fraction of the available central Australian solar resource and produces multiples of Australian domestic demand — is robust to reasonable variation in any single assumption.
8. Next Steps
- Complete the four Solar Region polygon definitions to engineering precision, including elevation profiles, soil and water suitability surveys, and cultural exclusion zones.
- Engage chartered engineers to validate the deployment density assumption against detailed Australian site conditions.
- Engage indigenous traditional owners across the four regions for early co-design discussions on land use, cultural heritage, and economic partnership structures.
- Develop the agrivoltaic productive country memo as the companion case for the unused 97% of the regions.
- Develop the corridor town settlement architecture memo at 100 km spacing as the operational substrate for the deployment.
- Develop the Alice Hub aqueduct and water systems memo as the enabling infrastructure for habitable, maintainable inland deployment.
- Develop the export market and submarine cable memo as the demand-side counterpart to this resource memo.
- Develop a data centre and AI compute siting memo as the strategic case for capturing the high-margin downstream economy in Australia.